nerd lab / undata

// a nerd lab experiment · unofficial

UN data in Python, without the guessing.

Type a country's name, get a table with its source on every row. undata is a Python package for the UN System Data Commons, which holds statistics from 26 UN System entities, and it is written for colleagues who need numbers for a report, not a course in APIs.

pip install undata

Everything on this page is real. Each use case below is a script in examples/. The output, the charts and the sentence for your report are what those scripts produced against the live platform on 13 October 2026, and the same scripts run again every night.

// 01 — use cases

Twelve requests, as they actually arrive

Each one starts from a real kind of request in UN work and ends with something you can send: a table, a chart, an Excel file, or a sentence for the report. Each takes a few lines of Python and a few minutes.

01Resident Coordinator's Officebriefing note

A briefing note before a country visit

"The RC is in N'Djamena on Monday. I need one page: electricity, child mortality and schooling in Chad, compared with the other Sahel countries."

The ask

The code

pythonexamples/01_country_briefing.py
"""Briefing note: Chad against its Sahel neighbours, in one table and one sentence."""

import undata as un

SAHEL = ["Chad", "Niger", "Mali", "Burkina Faso", "Mauritania", "Sudan"]
MEASURES = {
    "electricity %": "undata/sdg/EG_ACS_ELEC",
    "under-5 deaths per 1,000": "undata/unicef/CME_MR.AGE--Y0T4",
    "primary completion %": "undata/sdg/SE_TOT_CPLR.EDUCATION_LEVEL--ISCED11_1",
}

# One row per country, a value and a year per measure.
brief = un.compare(MEASURES, SAHEL).set_index("country")
print(brief.drop(columns="iso3").round(1).to_string(), "\n")

# The sentence for the note, worked out from the numbers rather than typed in.
RANK = {1: "", 2: "second-", 3: "third-", 4: "fourth-", 5: "fifth-", 6: "sixth-"}
chad = brief.loc["Chad"]
power_rank = int(brief["electricity %"].rank()["Chad"])  # 1 = the lowest
deaths_rank = int(brief["under-5 deaths per 1,000"].rank(ascending=False)["Chad"])  # 1 = highest
print(
    f"In {chad['electricity % year']}, {chad['electricity %']:.0f}% of people in Chad had "
    f"electricity, the {RANK[power_rank]}lowest of the six Sahel countries compared, and "
    f"{chad['under-5 deaths per 1,000']:.0f} of every 1,000 children died before their fifth "
    f"birthday, the {RANK[deaths_rank]}highest."
)

The picture

Access to electricity

Access to electricity, Sahel0%50%100%Sudan: 66% (2024)Sudan66%Mauritania: 52% (2024)Mauritania52%Mali: 50% (2024)Mali50%Burkina Faso: 34% (2024)Burkina Faso34%Niger: 21% (2024)Niger21%Chad: 13% (2024)Chad13%

Under-5 deaths per 1,000 live births

Under-5 deaths per 1,000 live births, Sahel0100200Niger: 111 (2024)Niger111Chad: 97 (2024)Chad97Burkina Faso: 75 (2024)Burkina Faso75Mali: 73 (2024)Mali73Sudan: 62 (2024)Sudan62Mauritania: 37 (2024)Mauritania37

Primary completion

Primary completion, Sahel0%50%100%Sudan: 65% (2014)Sudan65%Burkina Faso: 60% (2021)Burkina Faso60%Mauritania: 58% (2015)Mauritania58%Mali: 48% (2024)Mali48%Niger: 36% (2022)Niger36%Chad: 27% (2019)Chad27%
Chad in green. Latest year for each country; hover a bar for its year.

What came back

outputlive, 13 October 2026
01_country_briefing.py:13: MixedYearsWarning: The latest values for School completion rate [Education level=Primary education (ISCED11 - 1)] come from different years, 2014 to 2024. Values from different years are not directly comparable; the year column shows which is which. Pass within=N to keep only values from the past N years.
  brief = un.compare(MEASURES, SAHEL).set_index("country")
              electricity %  electricity % year  under-5 deaths per 1,000  under-5 deaths per 1,000 year  primary completion %  primary completion % year
country                                                                                                                                                  
Burkina Faso           34.0                2024                      74.9                           2024                  60.3                       2021
Chad                   13.4                2024                      97.3                           2024                  26.9                       2019
Mali                   49.5                2024                      73.0                           2024                  47.5                       2024
Mauritania             52.2                2024                      36.9                           2024                  57.9                       2015
Niger                  21.3                2024                     110.7                           2024                  35.8                       2022
Sudan                  66.0                2024                      61.6                           2024                  65.4                       2014 

In 2024, 13% of people in Chad had electricity, the lowest of the six Sahel countries compared, and 97 of every 1,000 children died before their fifth birthday, the second-highest.
For your note

In 2024, 13% of people in Chad had electricity, the lowest of the six Sahel countries compared, and 97 of every 1,000 children died before their fifth birthday, the second-highest.

  • Mixed years, flagged. "Latest" school completion ranges across a decade between these six countries. The warning says so before the table can mislead anyone, and the year is on every row.
  • Names as you write them. Six country names, no codes. Three indicators come back in one request.
02SDG reportingprogress report

Is a target moving?

"For the regional SDG progress report: has maternal mortality in Southern Asia fallen since 2015, and where is it already below 70?"

The ask

The code

pythonexamples/02_sdg_progress.py
"""SDG 3.1: has maternal mortality fallen since 2015, and where is it below 70?"""

import undata as un

# The SDG indicator number works directly: 3.1.1 is the maternal mortality ratio.
change = un.change("3.1.1", "Southern Asia", 2015, 2023).sort_values("end_value")
print(change[["country", "start_value", "end_value", "change_pct"]].round(0).to_string(index=False))

# The regional and world figures, as published, to set the countries against.
print(
    un.totals("3.1.1", ["Southern Asia", "World"], years=2023)[["country", "value"]].round(0), "\n"
)

fell = int((change["change"] < 0).sum())
fell_in = f"all {fell}" if fell == len(change) else f"{fell} of the {len(change)}"
below = change.loc[change["end_value"] < 70, "country"].tolist()
print(
    f"Between 2015 and 2023, maternal mortality fell in {fell_in} countries of Southern Asia. "
    f"{len(below)} were below 70 deaths per 100,000 live births in 2023 ({', '.join(below)}), "
    "the level Target 3.1 sets for the world as a whole."
)

The picture

Maternal deaths per 100,000 live births, Southern Asia, 2015 and 202320152023202302505007501,00070Afghanistan: 741 in 2015, 521 in 2023 (-30%)Afghanistan521Pakistan: 202 in 2015, 155 in 2023 (-23%)Pakistan155Nepal: 236 in 2015, 142 in 2023 (-40%)Nepal142Bangladesh: 204 in 2015, 115 in 2023 (-43%)Bangladesh115India: 129 in 2015, 80 in 2023 (-37%)India80Bhutan: 68 in 2015, 47 in 2023 (-32%)Bhutan47Maldives: 41 in 2015, 32 in 2023 (-22%)Maldives32Sri Lanka: 22 in 2015, 18 in 2023 (-17%)Sri Lanka18Iran (Islamic Republic of): 22 in 2015, 16 in 2023 (-29%)Iran (Islamic Republic of)16
Maternal deaths per 100,000 live births. The dashed line marks 70, the level Target 3.1 sets for the world.

What came back

outputlive, 13 October 2026
                   country  start_value  end_value  change_pct
Iran (Islamic Republic of)         22.0       16.0       -29.0
                 Sri Lanka         22.0       18.0       -17.0
                  Maldives         41.0       32.0       -22.0
                    Bhutan         68.0       47.0       -32.0
                     India        129.0       80.0       -37.0
                Bangladesh        204.0      115.0       -43.0
                     Nepal        236.0      142.0       -40.0
                  Pakistan        202.0      155.0       -23.0
               Afghanistan        741.0      521.0       -30.0
         country  value
0  Southern Asia  117.0
1          World  197.0 

Between 2015 and 2023, maternal mortality fell in all 9 countries of Southern Asia. 4 were below 70 deaths per 100,000 live births in 2023 (Iran (Islamic Republic of), Sri Lanka, Maldives, Bhutan), the level Target 3.1 sets for the world as a whole.
For your report

Between 2015 and 2023, maternal mortality fell in all 9 countries of Southern Asia. 4 were below 70 deaths per 100,000 live births in 2023 (Iran (Islamic Republic of), Sri Lanka, Maldives, Bhutan), the level Target 3.1 sets for the world as a whole.

  • The SDG number is enough. "3.1.1" finds the one series that reports the indicator; where several do, undata lists them instead of picking one.
  • The official regional figure, not an average. un.totals returns the number the agency published for the region and the world.
  • Careful wording, built in. 70 per 100,000 is the level Target 3.1 sets for the world as a whole, not a national target, and the sentence says so.

03Gender focal pointInternational Women's Day

Women in parliament, by region

"For our 8 March piece: which parliaments in Eastern Africa have at least 30% women, and has anyone reached parity?"

The ask

The code

pythonexamples/03_women_in_parliament.py
"""Women in parliament: who has passed 30%, and who has reached parity?"""

import undata as un

SEATS = "undata/sdg/SG_GEN_PARL.SEX--F"  # % of seats held by women, SDG 5.5.1

table = un.latest(SEATS, "Eastern Africa").sort_values("value", ascending=False)
print(table[["country", "year", "value"]].round(1).to_string(index=False), "\n")

thirty = table[table["value"] >= 30]
parity = table[table["value"] >= 50]
print(
    f"{len(thirty)} of the {len(table)} Eastern African parliaments with data have at least "
    f"30% women. {', '.join(parity['country'])} passed parity, with "
    f"{parity['value'].iloc[0]:.0f}% of seats held by women."
)

The picture

Share of parliamentary seats held by women, Eastern Africa0%25%50%75%100%30%parityRwanda: 64% (2026)Rwanda64%Ethiopia: 42% (2026)Ethiopia42%Burundi: 40% (2026)Burundi40%Mozambique: 38% (2026)Mozambique38%United Republic of Tanzania: 38% (2026)United Republic of Tanzania38%Uganda: 34% (2026)Uganda34%South Sudan: 32% (2026)South Sudan32%Zimbabwe: 30% (2026)Zimbabwe30%Seychelles: 26% (2026)Seychelles26%Djibouti: 26% (2026)Djibouti26%Kenya: 23% (2026)Kenya23%Eritrea: 22% (2019)Eritrea22%Malawi: 21% (2026)Malawi21%Somalia: 19% (2026)Somalia19%Comoros: 18% (2026)Comoros18%Mauritius: 18% (2026)Mauritius18%Madagascar: 16% (2026)Madagascar16%Zambia: 15% (2026)Zambia15%
Share of seats held by women, latest year. The dashed lines mark 30% and parity; past parity in green.

What came back

outputlive, 13 October 2026
03_women_in_parliament.py:7: MissingDataWarning: No data for 4 of 22 country/indicator combinations. They are left out of the table, not set to zero:
  Proportion of seats in national parliaments held by women [Sex=Female]: French Southern Territories, British Indian Ocean Territory, Mayotte, Réunion
The full list is in table.attrs['missing'].
  table = un.latest(SEATS, "Eastern Africa").sort_values("value", ascending=False)
03_women_in_parliament.py:7: MixedYearsWarning: The latest values for Proportion of seats in national parliaments held by women [Sex=Female] come from different years, 2019 to 2026. Values from different years are not directly comparable; the year column shows which is which. Pass within=N to keep only values from the past N years.
  table = un.latest(SEATS, "Eastern Africa").sort_values("value", ascending=False)
                    country  year  value
                     Rwanda  2026   63.8
                   Ethiopia  2026   41.9
                    Burundi  2026   39.6
                 Mozambique  2026   38.0
United Republic of Tanzania  2026   37.6
                     Uganda  2026   34.0
                South Sudan  2026   32.4
                   Zimbabwe  2026   30.1
                 Seychelles  2026   26.5
                   Djibouti  2026   26.2
                      Kenya  2026   23.0
                    Eritrea  2019   22.0
                     Malawi  2026   21.4
                    Somalia  2026   19.0
                    Comoros  2026   18.2
                  Mauritius  2026   17.9
                 Madagascar  2026   16.0
                     Zambia  2026   15.0 

8 of the 18 Eastern African parliaments with data have at least 30% women. Rwanda passed parity, with 64% of seats held by women.
For your piece

8 of the 18 Eastern African parliaments with data have at least 30% women. Rwanda passed parity, with 64% of seats held by women.

  • A region is a list of countries. "Eastern Africa" expands to every country the UN places there, so no one has to type eighteen names.
  • The odd one out is visible. One country's latest figure is years older than the rest; the year column and the warning show which.

04Humanitarian coordinationsituation overview

Refugees: count or share?

"Which countries in the region have the most people living as refugees abroad, and does the picture change once you account for population?"

The ask

The code

pythonexamples/04_refugees.py
"""Refugees by country of origin: the most in number is not the most per person."""

import undata as un

NUMBER = "undata/unicef/MG_RFGS_CNTRY_ORIGIN"  # refugees, by country of origin
PER_100K = "undata/sdg/SM_POP_REFG_OR"  # the same, per 100,000 population

# A region and a country together: Sudan is in Northern Africa in the UN's regions.
table = un.latest([NUMBER, PER_100K], ["Eastern Africa", "Sudan"])

for indicator, label in [(NUMBER, "Most refugees"), (PER_100K, "Most per 100,000 people")]:
    top = table[table["indicator"] == indicator].nlargest(5, "value")
    print(label)
    print(top[["country", "year", "value"]].to_string(index=False), "\n")

number = table[table["indicator"] == NUMBER].set_index("country")["value"]
rate = table[table["indicator"] == PER_100K].set_index("country")["value"]
print(
    f"{number.idxmax()} has the most refugees abroad ({number.max() / 1e6:.1f} million), but "
    f"relative to population {rate.idxmax()} is hit hardest: {rate.max():,.0f} refugees "
    f"for every 100,000 people, about one in {100_000 / rate.max():.0f}."
)

The picture

Refugees, by country of origin

Refugees, by country of origin02.0M4.0MSudan: 2.8M (2025)Sudan2.8MSouth Sudan: 2.4M (2025)South Sudan2.4MSomalia: 892K (2025)Somalia892KEritrea: 555K (2025)Eritrea555KBurundi: 318K (2025)Burundi318KRwanda: 244K (2025)Rwanda244K

Refugees per 100,000 people

Refugees per 100,000 people010,00020,000South Sudan: 16,352 (2025)South Sudan16,352Eritrea: 13,442 (2025)Eritrea13,442Sudan: 4,556 (2025)Sudan4,556Somalia: 4,397 (2025)Somalia4,397Burundi: 2,206 (2025)Burundi2,206Rwanda: 1,664 (2025)Rwanda1,664
Two measures, two charts: never two scales on one axis. South Sudan in green.

What came back

outputlive, 13 October 2026
04_refugees.py:9: MissingDataWarning: No data for 7 of 46 country/indicator combinations. They are left out of the table, not set to zero:
  Number of refugees, by country of origin: French Southern Territories, British Indian Ocean Territory, Mayotte, Réunion
  Number of refugees per 100,000 population, by country of origin: French Southern Territories, British Indian Ocean Territory, Mayotte
The full list is in table.attrs['missing'].
  table = un.latest([NUMBER, PER_100K], ["Eastern Africa", "Sudan"])
Most refugees
    country  year     value
      Sudan  2025 2820758.0
South Sudan  2025 2386502.0
    Somalia  2025  892043.0
    Eritrea  2025  554902.0
    Burundi  2025  318294.0 

Most per 100,000 people
    country  year       value
South Sudan  2025 16351.75013
    Eritrea  2025 13441.94796
      Sudan  2025  4556.26252
    Somalia  2025  4396.63137
    Burundi  2025  2206.18452 

Sudan has the most refugees abroad (2.8 million), but relative to population South Sudan is hit hardest: 16,352 refugees for every 100,000 people, about one in 6.
For your overview

Sudan has the most refugees abroad (2.8 million), but relative to population South Sudan is hit hardest: 16,352 refugees for every 100,000 people, about one in 6.

  • Regions and countries mix. Sudan sits in Northern Africa in the UN's regions, so it is added by name next to "Eastern Africa".
  • Two measures, two charts. A count and a rate never share an axis; that is how a chart invents a pattern.

05Peace and securityCouncil briefing

Conflict deaths in context

"For the briefing: where are conflict-related deaths highest, and how do they compare with ordinary homicide in the same countries?"

The ask

The code

pythonexamples/05_conflict_and_homicide.py
"""Conflict deaths in context: who reports them, and how they compare with homicide."""

import undata as un

INDICATORS = {
    "conflict": "undata/sdg/VC_DTH_TOTR",  # conflict-related deaths per 100,000, SDG 16.1.2
    "homicide": "undata/sdg/VC_IHR_PSRC",  # intentional homicide per 100,000, SDG 16.1.1
}

# Ask for the whole world. The warning says how many countries have both: few.
table = un.compare(INDICATORS, "World")
reporting = table[table["conflict"].notna()].sort_values("conflict", ascending=False)
print(reporting[["country", "conflict", "homicide"]].round(1).to_string(index=False), "\n")

higher = reporting.loc[reporting["conflict"] > reporting["homicide"], "country"].tolist()
print(
    f"Only {len(reporting)} countries report conflict-related deaths. In {len(higher)} of "
    f"them, conflict killed more people per 100,000 than homicide: {', '.join(higher)}."
)

What came back

outputlive, 13 October 2026
05_conflict_and_homicide.py:11: MixedYearsWarning: The latest values for Number of victims of intentional homicide per 100,000 population come from different years, 2006 to 2024. Values from different years are not directly comparable; the year column shows which is which. Pass within=N to keep only values from the past N years.
  table = un.compare(INDICATORS, "World")
05_conflict_and_homicide.py:11: CoverageWarning: 13 of 248 countries have all 2 indicators. Only conflict: Burkina Faso, Central African Republic, Democratic Republic of the Congo, Libya, Mali, Somalia, Sudan. Only homicide: Albania, Algeria, American Samoa, Andorra, Angola, Anguilla, Antigua and Barbuda, Argentina and 177 more. No data at all for 43, left out.
  table = un.compare(INDICATORS, "World")
                         country  conflict  homicide
              State of Palestine     121.2       0.3
            Syrian Arab Republic      27.7       2.1
                           Sudan      21.9       NaN
                     South Sudan      18.8      14.0
                    Burkina Faso       6.6       NaN
                         Ukraine       6.4       3.8
                         Lebanon       5.8       2.6
        Central African Republic       4.9       NaN
Democratic Republic of the Congo       3.4       NaN
                         Myanmar       2.8       3.9
                         Somalia       1.8       NaN
                            Mali       1.6       NaN
                     Afghanistan       0.5       4.2
                        Ethiopia       0.3       8.5
                           Libya       0.3       NaN
                        Cameroon       0.2       6.8
                           Yemen       0.1       5.8
                        Colombia       0.1      24.4
                            Iraq       0.1       9.5
                     Philippines       0.0       4.3 

Only 20 countries report conflict-related deaths. In 5 of them, conflict killed more people per 100,000 than homicide: State of Palestine, Syrian Arab Republic, South Sudan, Ukraine, Lebanon.
For your briefing

Only 20 countries report conflict-related deaths. In 5 of them, conflict killed more people per 100,000 than homicide: State of Palestine, Syrian Arab Republic, South Sudan, Ukraine, Lebanon.

  • Who has what, spelled out. un.compare says how many countries have both indicators and names the rest.
  • Absent is not zero. Asking for the whole world shows how few countries report conflict deaths at all. Peaceful countries are missing, not zero, and a chart of "all countries" would be a chart of countries at war.
  • Gaps stay gaps. Where homicide data is missing, the table shows a blank, not a zero, and the warning names the countries.

06Statistics focal pointquoting a figure

When agencies disagree

"Two reports quote different maternal mortality figures for Bangladesh. Which is right, and what should we cite?"

The ask

The code

pythonexamples/06_agencies_disagree.py
"""One statistic, three agencies. Quote one figure, and name whose it is."""

import undata as un

MATERNAL_MORTALITY_RATIO = [
    "undata/sdg/SH_STA_MORT.SEX--F",  # Global SDG Indicators Database
    "undata/unicef/MNCH_MMR.SEX--F",  # UNICEF
    "undata/undphdro/GII_mmr.SEX--F",  # UNDP Human Development Report Office
]
table = un.latest(MATERNAL_MORTALITY_RATIO, "Bangladesh")
print(table[["source", "year", "value"]].round(1).to_string(index=False), "\n")

low, high = table["value"].min(), table["value"].max()
odd = table.loc[table["value"].idxmax(), "source"]
print(
    f"For Bangladesh in {table['year'].max()}, the three sources give {low:.0f} to {high:.0f} "
    f"maternal deaths per 100,000 live births; {odd} is the outlier. A gap of "
    f"{(high / low - 1) * 100:.0f}% is enough to change a headline, so cite the source."
)

What came back

outputlive, 13 October 2026
             source  year  value
SDG Global Database  2023  115.1
          UNDP-HDRO  2023  123.0
             UNICEF  2023  115.1 

For Bangladesh in 2023, the three sources give 115 to 123 maternal deaths per 100,000 live births; UNDP-HDRO is the outlier. A gap of 7% is enough to change a headline, so cite the source.
For your reply

For Bangladesh in 2023, the three sources give 115 to 123 maternal deaths per 100,000 live births; UNDP-HDRO is the outlier. A gap of 7% is enough to change a headline, so cite the source.

  • The source is on every row. The platform holds the same statistic from several agencies. undata never blends them, and the source column says whose number you have.

07Publications teamdata pack

A regional data pack in Excel

"Send the publications team an Excel file for South-Eastern Asia: electricity, drinking water and primary completion, with sources."

The ask

The code

pythonexamples/07_regional_data_pack.py
"""A data pack for the publications team: three indicators, one Excel file, sources included."""

import pandas as pd

import undata as un

INDICATORS = [
    "undata/sdg/EG_ACS_ELEC",  # access to electricity
    "undata/sdg/SH_H2O_SAFE",  # safely managed drinking water
    "undata/sdg/SE_TOT_CPLR.EDUCATION_LEVEL--ISCED11_1",  # primary completion
]

table = un.latest(INDICATORS, "South-Eastern Asia")
path = un.save(table, "south-eastern-asia-data-pack.xlsx")

sheets = pd.ExcelFile(path).sheet_names
print(f"Saved {len(table)} values for {table['country'].nunique()} countries to {path}")
print("Sheets:", ", ".join(sheets), "\n")
print(un.cite(table))

What came back

outputlive, 13 October 2026
07_regional_data_pack.py:13: MissingDataWarning: No data for 6 of 33 country/indicator combinations. They are left out of the table, not set to zero:
  Proportion of population using safely managed drinking water services: Brunei Darussalam, Thailand, Timor-Leste
  School completion rate [Education level=Primary education (ISCED11 - 1)]: Brunei Darussalam, Malaysia, Singapore
The full list is in table.attrs['missing'].
  table = un.latest(INDICATORS, "South-Eastern Asia")
07_regional_data_pack.py:13: MixedYearsWarning: The latest values for School completion rate [Education level=Primary education (ISCED11 - 1)] come from different years, 2016 to 2023. Values from different years are not directly comparable; the year column shows which is which. Pass within=N to keep only values from the past N years.
  table = un.latest(INDICATORS, "South-Eastern Asia")
Saved 27 values for 11 countries to south-eastern-asia-data-pack.xlsx
Sheets: data, sources, no data, coverage 

SDG Global Database. Proportion of population using safely managed drinking water services (undata/sdg/SH_H2O_SAFE). https://unstats.un.org/sdgs/dataportal. Retrieved 2026-10-13 from the UN System Data Commons, https://data.un.org.
SDG Global Database. Proportion of population with access to electricity (undata/sdg/EG_ACS_ELEC). https://unstats.un.org/sdgs/dataportal. Retrieved 2026-10-13 from the UN System Data Commons, https://data.un.org.
SDG Global Database. School completion rate [Education level=Primary education (ISCED11 - 1)] (undata/sdg/SE_TOT_CPLR.EDUCATION_LEVEL--ISCED11_1). https://unstats.un.org/sdgs/dataportal. Retrieved 2026-10-13 from the UN System Data Commons, https://data.un.org.
  • Citations travel with the data. The sources sheet holds a citation for each indicator, crediting the agency that produced it.
  • Gaps get their own sheet. The no data sheet lists every country and indicator with nothing to report, so a blank cell is never mistaken for a zero.

08Monitoring and evaluationdashboard

A dashboard that refreshes itself

"Our Power BI dashboard needs fresh numbers every month, without anyone remembering to update it."

The ask

The code

pythonexamples/08_dashboard_refresh.py
"""Refresh the numbers behind a dashboard. Schedule this file; nobody has to run it."""

from datetime import date

import undata as un

INDICATORS = [
    "undata/sdg/EG_ACS_ELEC",
    "undata/unicef/CME_MR.AGE--Y0T4",
    "undata/sdg/SG_GEN_PARL.SEX--F",
]

table = un.get(INDICATORS, "Southern Asia", years=(2015, date.today().year))
un.save(table, "dashboard-data.csv")  # Power BI, Tableau or Excel reads this file

print(
    f"{date.today()}: wrote {len(table)} rows for {table['country'].nunique()} countries, "
    f"{table['year'].min()} to {table['year'].max()}, to dashboard-data.csv"
)

What came back

outputlive, 13 October 2026
2026-10-13: wrote 280 rows for 9 countries, 2015 to 2026, to dashboard-data.csv

Then schedule it

schedule.github/workflows/refresh.yml, or your computer's scheduler
# In a GitHub repository: runs on the 1st of every month and commits the new file.
on:
  schedule:
    - cron: "0 6 1 * *"
jobs:
  refresh:
    runs-on: ubuntu-latest
    permissions:
      contents: write
    steps:
      - uses: actions/checkout@v7
      - run: pip install undata && python 08_dashboard_refresh.py
      - run: |
          git config user.name "dashboard bot" && git config user.email "bot@example.org"
          git add dashboard-data.csv && git commit -m "Refresh dashboard data" || true
          git push

# On Windows instead: Task Scheduler, "Start a program", python 08_dashboard_refresh.py
  • Same shape every month. The columns never change, so the dashboard's queries keep working after every refresh.

10SDG reportingprogress report

Who is on track for 2030?

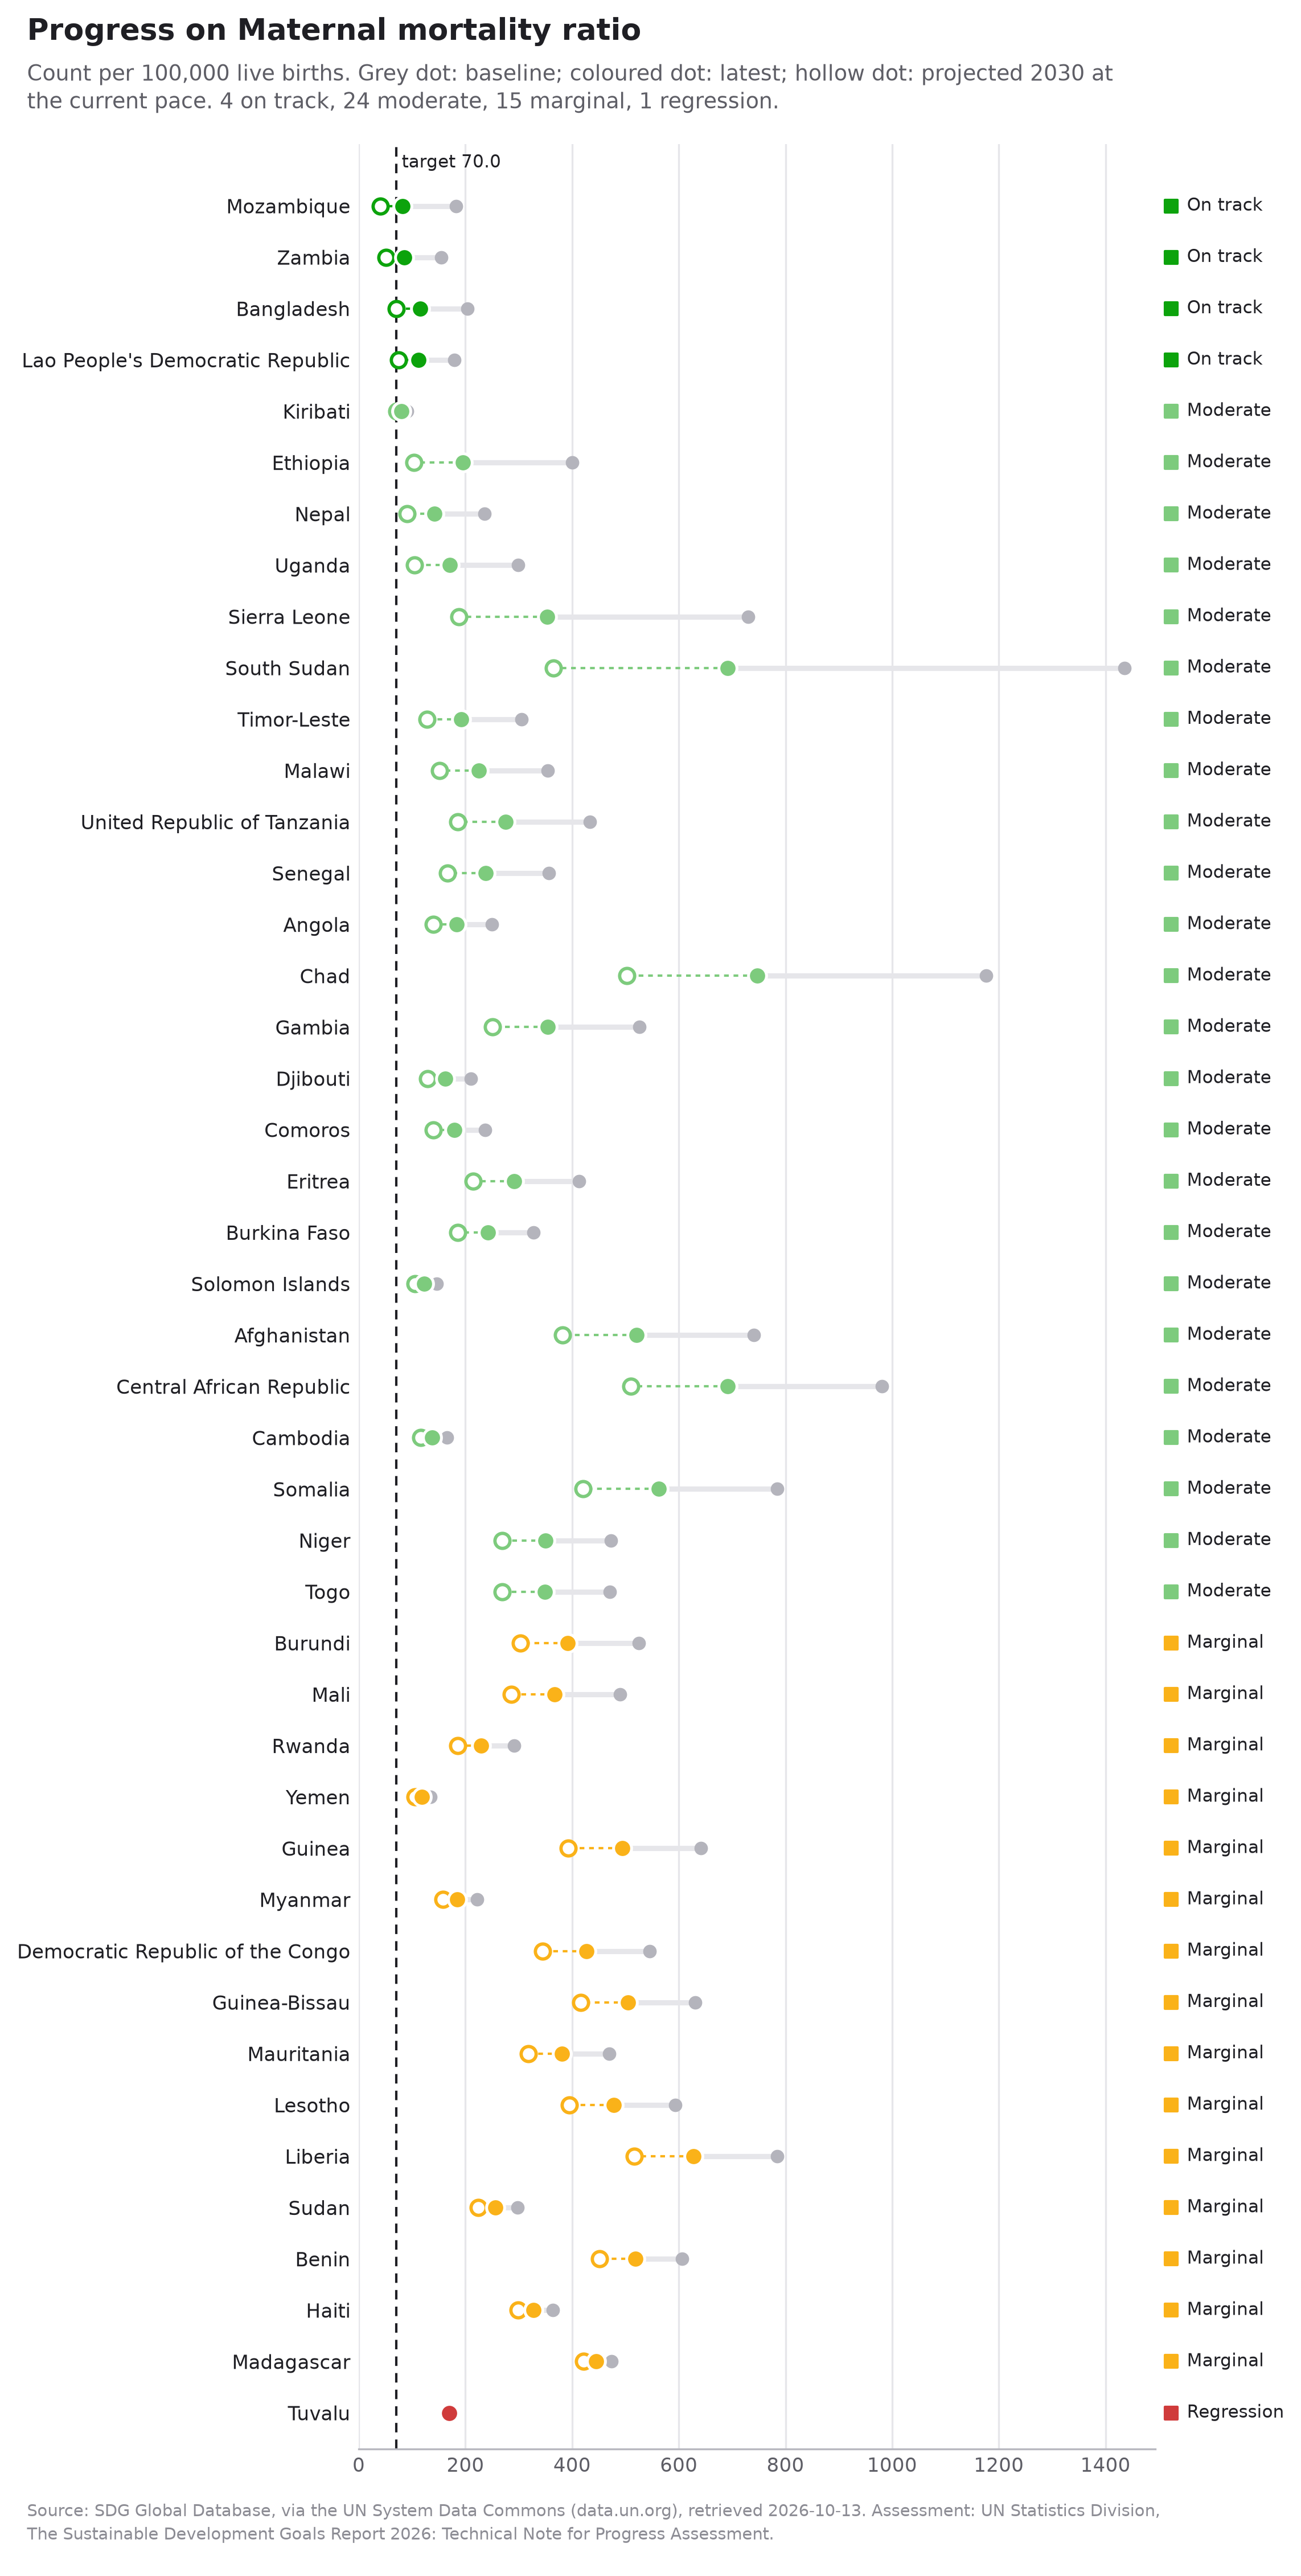
"For the LDC chapter of the SDG progress report: which least developed countries are on track to bring maternal mortality below 70 by 2030, using the same method as the UN's own report?"

The ask

The code

pythonexamples/10_sdg_progress_ldcs.py
"""Are the least developed countries on track to cut maternal deaths by 2030?"""

import undata as un

# SDG 3.1.1, lower is better; 70 per 100,000 live births is the Target 3.1 level.
table = un.progress("3.1.1", "LDCs", better="lower", target=70)

columns = ["country", "status", "baseline_year", "baseline_value", "latest_value", "projected"]
print(table[columns].head(8).round(0).to_string(index=False), "\n")

un.chart(table, "ldc-progress.png")  # for the report
un.chart(table, "ldc-progress.html", interactive=True)  # hover for every number

print(un.describe(table))

The chart it saved

Maternal mortality ratio, 44 countries. Each country's trend since 2015 (or the first year after) is projected to 2030 and compared with the target of 70.0. 4 on track or target met (Bangladesh, Lao People's Democratic Republic, Mozambique, Zambia); 24 moderate progress, but acceleration needed; 15 marginal progress, and significant acceleration needed; 1 regression (Tuvalu). Method: UN Statistics Division, The Sustainable Development Goals Report 2026: Technical Note for Progress Assessment.
Open the interactive version: hover for every number.

What came back

outputlive, 13 October 2026
                         country                                     status  baseline_year  baseline_value  latest_value  projected
                      Mozambique                     On track or target met           2015           182.0          82.0       41.0
                          Zambia                     On track or target met           2015           154.0          85.0       51.0
                      Bangladesh                     On track or target met           2015           204.0         115.0       70.0
Lao People's Democratic Republic                     On track or target met           2015           180.0         112.0       74.0
                        Kiribati Moderate progress, but acceleration needed           2015            90.0          80.0       71.0
                        Ethiopia Moderate progress, but acceleration needed           2015           401.0         195.0      104.0
                           Nepal Moderate progress, but acceleration needed           2015           236.0         142.0       91.0
                          Uganda Moderate progress, but acceleration needed           2015           299.0         170.0      104.0 

Maternal mortality ratio, 44 countries. Each country's trend since 2015 (or the first year after) is projected to 2030 and compared with the target of 70.0. 4 on track or target met (Bangladesh, Lao People's Democratic Republic, Mozambique, Zambia); 24 moderate progress, but acceleration needed; 15 marginal progress, and significant acceleration needed; 1 regression (Tuvalu). Method: UN Statistics Division, The Sustainable Development Goals Report 2026: Technical Note for Progress Assessment.
For your chapter

Maternal mortality ratio, 44 countries. Each country's trend since 2015 (or the first year after) is projected to 2030 and compared with the target of 70.0. 4 on track or target met (Bangladesh, Lao People's Democratic Republic, Mozambique, Zambia); 24 moderate progress, but acceleration needed; 15 marginal progress, and significant acceleration needed; 1 regression (Tuvalu). Method: UN Statistics Division, The Sustainable Development Goals Report 2026: Technical Note for Progress Assessment.

  • The UN's method, not a home-made one. un.progress follows the UN Statistics Division's technical note step by step: the growth rate since 2015, projected to 2030, set against the change the target needs, then sorted into the same five categories the SDG Report uses.
  • The method is cited for you. The sentence ends with the source of the method, and table.attrs["method"] carries its link.
  • Status is never colour alone. Every row is labelled in words, so the chart survives printing in black and white and reads for colour-blind readers.

11Country teamcountry profile

A country profile on one chart

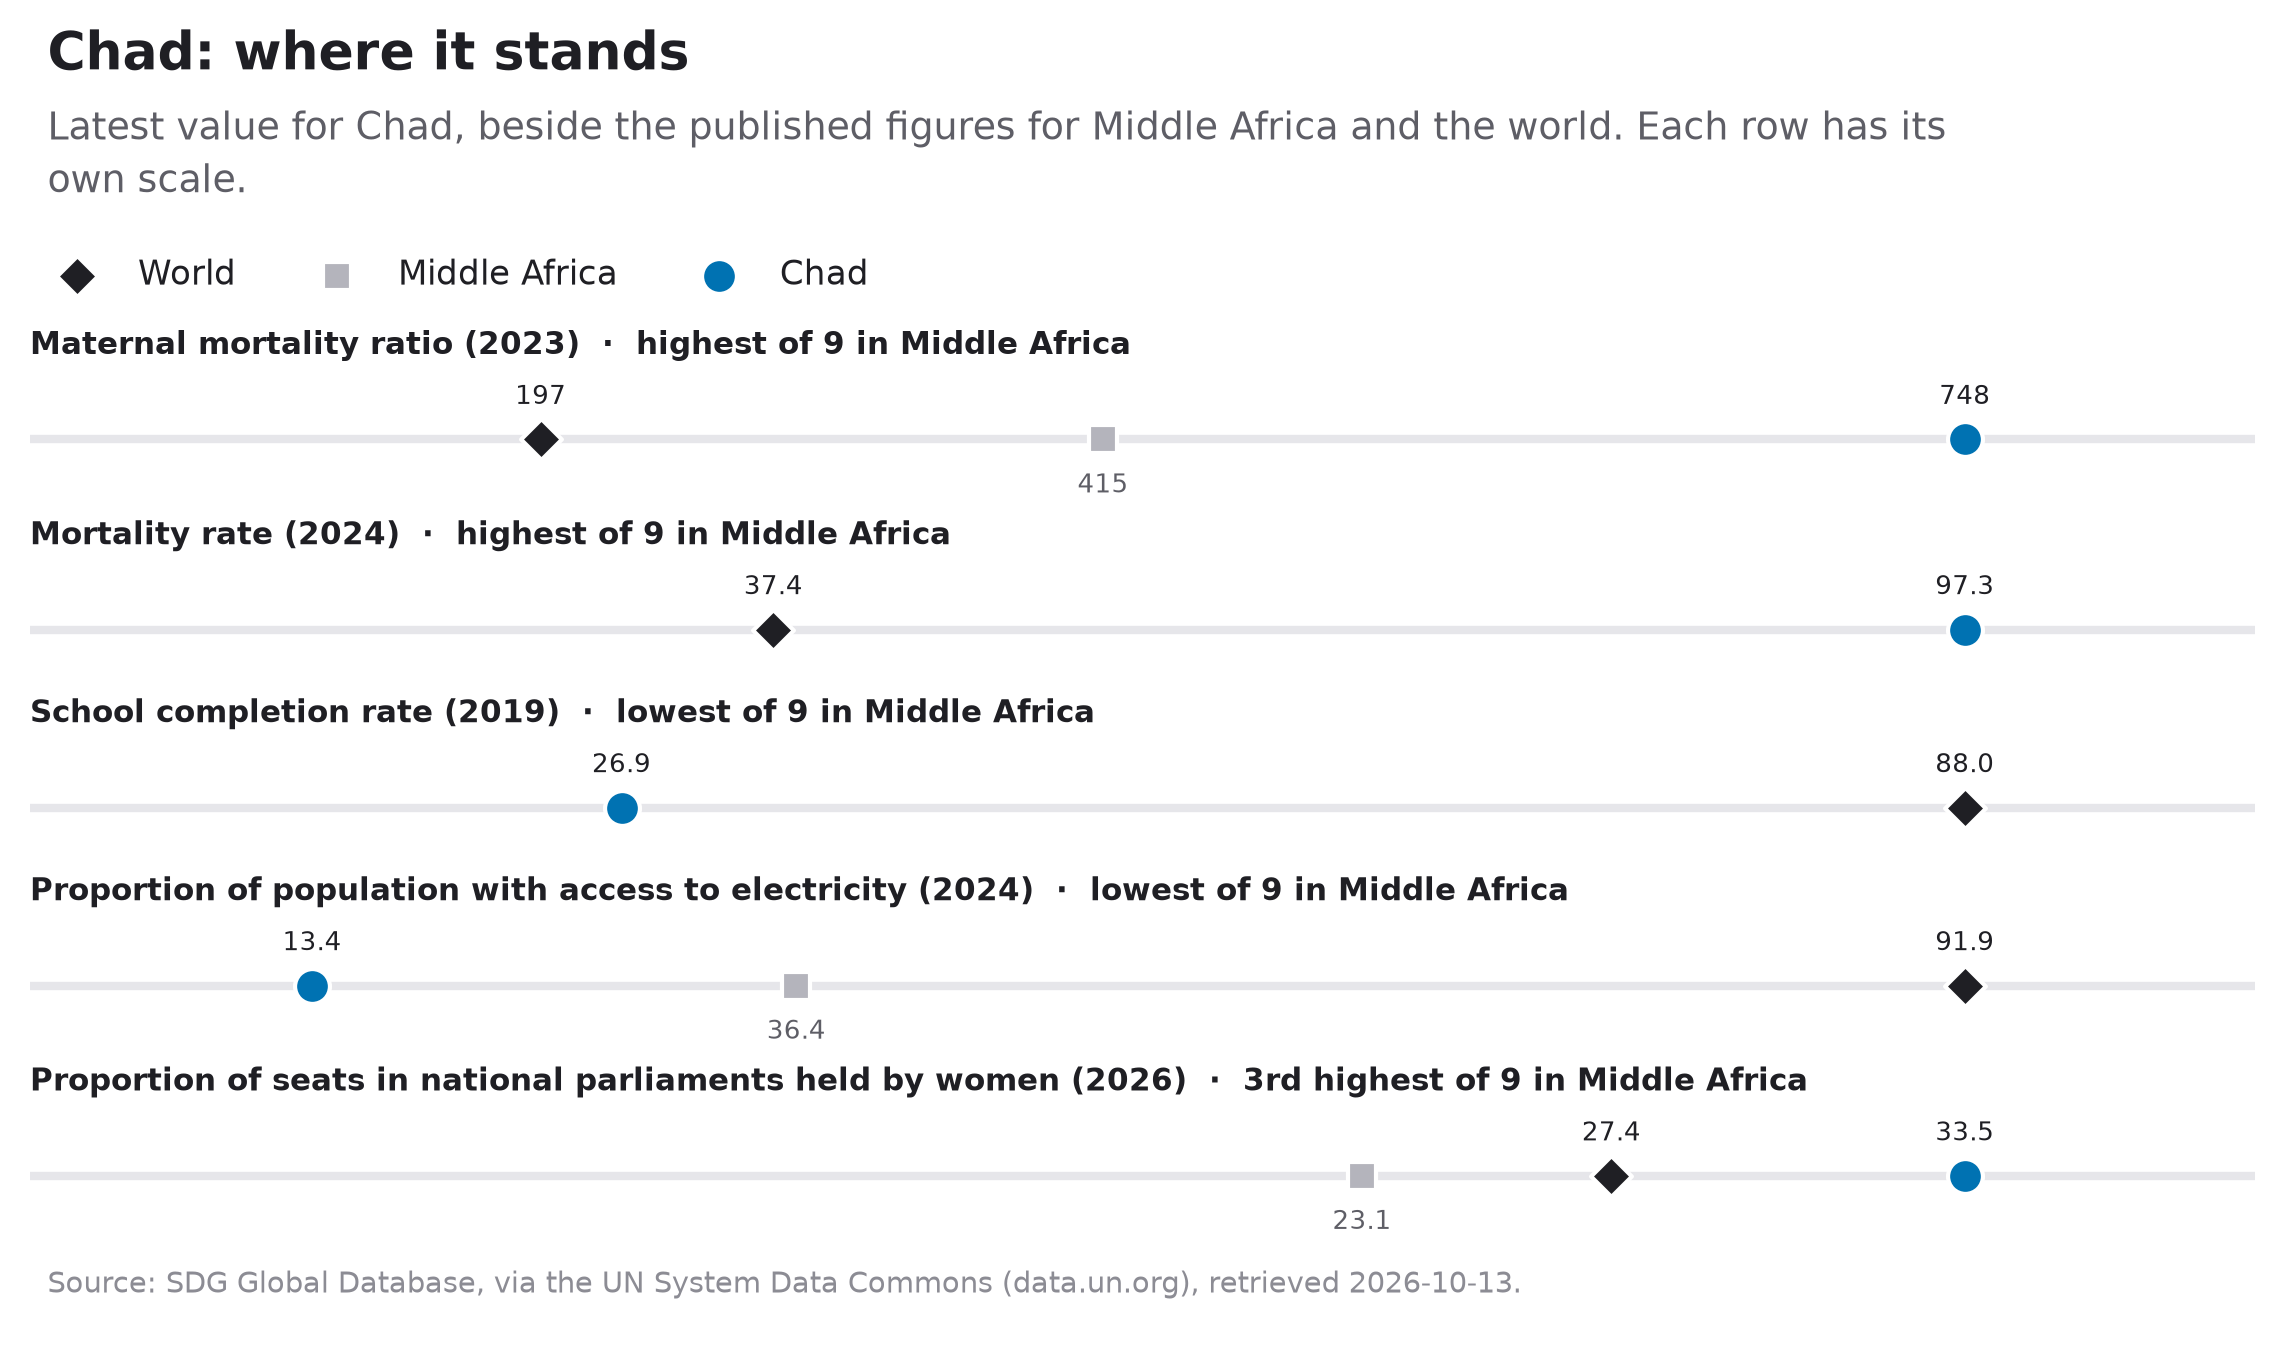
"The Resident Coordinator wants one picture for the Common Country Analysis: where does Chad stand on the basics, against its region and the world?"

The ask

The code

pythonexamples/11_country_profile.py
"""One page on Chad: where it stands against Middle Africa and the world."""

import undata as un

INDICATORS = [
    "3.1.1",  # maternal mortality
    "undata/sdg/SH_DYN_MORT.AGE--Y0T4",  # under-5 mortality, SDG 3.2.1
    "undata/sdg/SE_TOT_CPLR.EDUCATION_LEVEL--ISCED11_1",  # primary completion, 4.1.2
    "undata/sdg/EG_ACS_ELEC",  # access to electricity, 7.1.1
    "undata/sdg/SG_GEN_PARL.SEX--F",  # women in parliament, 5.5.1
]

table = un.profile("Chad", INDICATORS)

columns = ["indicator_name", "value", "year", "region_value", "world_value", "rank", "out_of"]
print(table[columns].round(1).to_string(index=False), "\n")

un.chart(table, "chad-profile.png")
print(un.describe(table))

The chart it saved

Chad, latest values beside Middle Africa and the world:
  Maternal mortality ratio: 748 (2023); highest of 9 in Middle Africa; world 197.
  Mortality rate: 97.3 (2024); highest of 9 in Middle Africa; world 37.4.
  School completion rate: 26.9 (2019); lowest of 9 in Middle Africa; world 88.0.
  Proportion of population with access to electricity: 13.4 (2024); lowest of 9 in Middle Africa; world 91.9.
  Proportion of seats in national parliaments held by women: 33.5 (2026); 3rd highest of 9 in Middle Africa; world 27.4.

What came back

outputlive, 13 October 2026
                                                          indicator_name  value  year  region_value  world_value  rank  out_of
                                   Maternal mortality ratio [Sex=Female]  747.5  2023         414.6        197.3     1       9
                                  Mortality rate [Age=Under 5 years old]   97.3  2024           NaN         37.4     1       9
School completion rate [Education level=Primary education (ISCED11 - 1)]   26.9  2019           NaN         88.0     9       9
                     Proportion of population with access to electricity   13.4  2024          36.4         91.9     9       9
  Proportion of seats in national parliaments held by women [Sex=Female]   33.5  2026          23.1         27.4     3       9 

Chad, latest values beside Middle Africa and the world:
  Maternal mortality ratio: 748 (2023); highest of 9 in Middle Africa; world 197.
  Mortality rate: 97.3 (2024); highest of 9 in Middle Africa; world 37.4.
  School completion rate: 26.9 (2019); lowest of 9 in Middle Africa; world 88.0.
  Proportion of population with access to electricity: 13.4 (2024); lowest of 9 in Middle Africa; world 91.9.
  Proportion of seats in national parliaments held by women: 33.5 (2026); 3rd highest of 9 in Middle Africa; world 27.4.
For your analysis

Chad, latest values beside Middle Africa and the world: Maternal mortality ratio: 748 (2023); highest of 9 in Middle Africa; world 197. Mortality rate: 97.3 (2024); highest of 9 in Middle Africa; world 37.4. School completion rate: 26.9 (2019); lowest of 9 in Middle Africa; world 88.0. Proportion of population with access to electricity: 13.4 (2024); lowest of 9 in Middle Africa; world 91.9. Proportion of seats in national parliaments held by women: 33.5 (2026); 3rd highest of 9 in Middle Africa; world 27.4.

  • The region is the UN's region. Chad's M49 region is Middle Africa, so that is the comparison, using the regional figures the agencies published, not an average undata made up.
  • Each row on its own scale. Deaths per 100,000 and a percentage never share an axis. Each indicator gets its own line, with every value written on it.
  • Ranks that read either way. "Highest of 9" is bad news for mortality and good news for women in parliament; the wording does not pretend otherwise.

12Leave no one behindequity analysis

Who is left behind

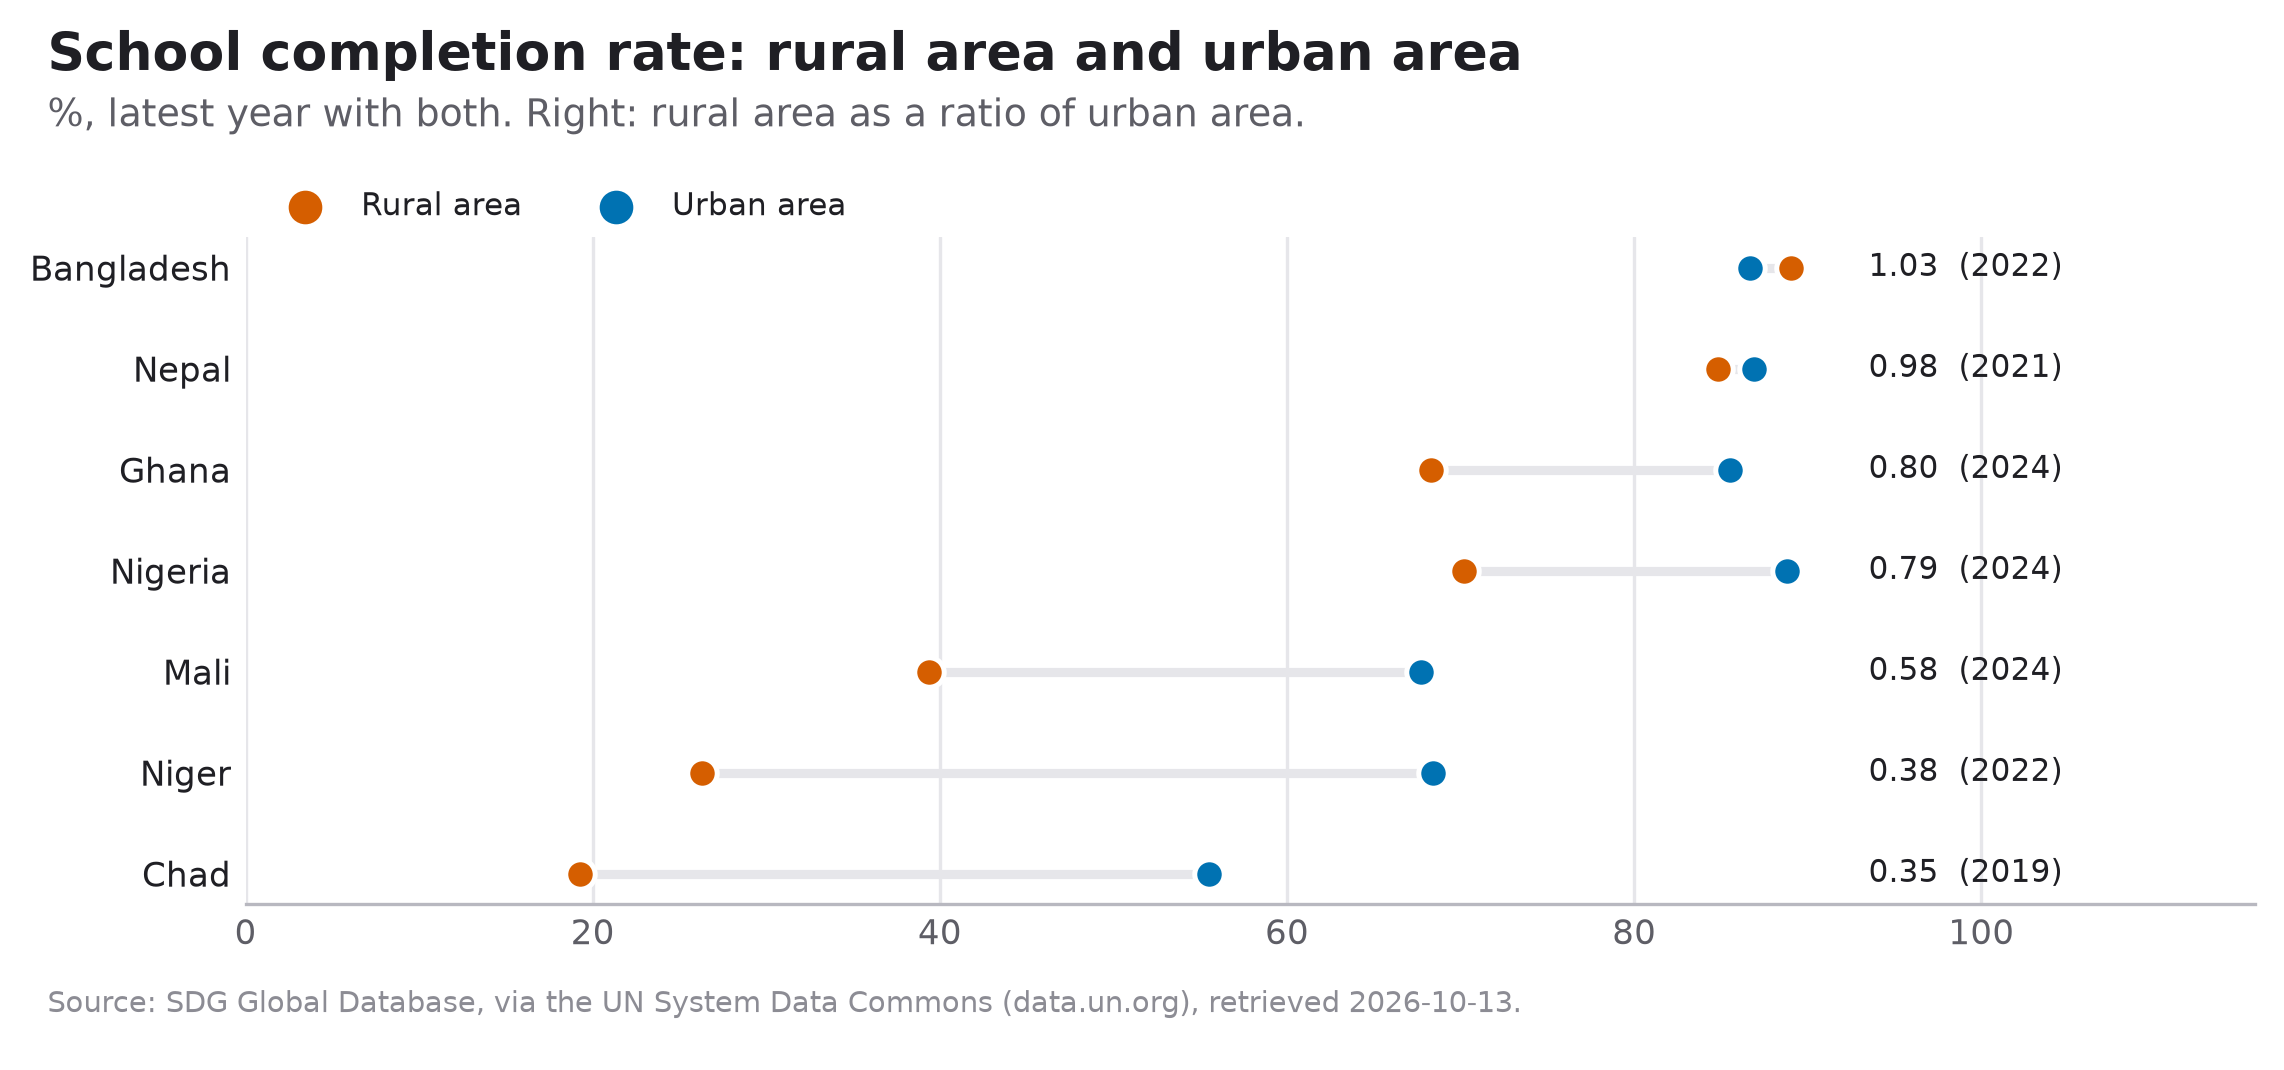
"For the leave-no-one-behind section: how much less likely are rural children to finish primary school than urban children, and where is the gap widest?"

The ask

The code

pythonexamples/12_rural_urban_gap.py
"""Who finishes primary school: the rural-urban gap in the Sahel and beyond."""

import undata as un

COMPLETION = "undata/sdg/SE_TOT_CPLR.EDUCATION_LEVEL--ISCED11_1"  # SDG 4.1.2, primary
COUNTRIES = ["Chad", "Niger", "Mali", "Nigeria", "Ghana", "Bangladesh", "Nepal"]

table = un.gap(COMPLETION, COUNTRIES, by="urbanization")  # rural against urban, same year

print(table.drop(columns=["iso3", "unit", "indicator", "source"]).round(2).to_string(index=False))
print()

un.chart(table, "rural-urban-gap.png")
print(un.describe(table))

The chart it saved

Comparing rural area with urban area in the latest year with both: the widest gap is in Chad, 19.3% against 55.5% in 2019 (a ratio of 0.35). 2 of 7 countries are within 0.97-1.03 of parity: Bangladesh, Nepal.

What came back

outputlive, 13 October 2026
   country  year  Rural area (degree of urbanization)  Urban area (degree of urbanization)  ratio  difference
      Chad  2019                                19.29                                55.49   0.35      -36.20
     Niger  2022                                26.28                                68.41   0.38      -42.13
      Mali  2024                                39.40                                67.69   0.58      -28.29
   Nigeria  2024                                70.20                                88.81   0.79      -18.62
     Ghana  2024                                68.29                                85.52   0.80      -17.23
Bangladesh  2022                                89.05                                86.66   1.03        2.39
     Nepal  2021                                84.85                                86.90   0.98       -2.05

Comparing rural area with urban area in the latest year with both: the widest gap is in Chad, 19.3% against 55.5% in 2019 (a ratio of 0.35). 2 of 7 countries are within 0.97-1.03 of parity: Bangladesh, Nepal.
For your section

Comparing rural area with urban area in the latest year with both: the widest gap is in Chad, 19.3% against 55.5% in 2019 (a ratio of 0.35). 2 of 7 countries are within 0.97-1.03 of parity: Bangladesh, Nepal.

  • Same year, both groups. un.gap compares rural and urban in the latest year that has both, so a 2019 figure is never set against a 2024 one.
  • Any breakdown the data has. by="sex", by="urbanization" or by="wealth quantile"; ask for one the indicator lacks and the error lists the ones it has.
  • Parity, defined. A ratio between 0.97 and 1.03 counts as parity, the band the UN uses for gender parity indices.

// 02 — start

Three lines to a spreadsheet

Open a notebook (Jupyter, VS Code or Google Colab), install the package, and run this. You get an Excel file with the numbers on one sheet and a citation for each source on the next.

python
import undata as un

table = un.get("undata/sdg/SH_STA_MORT.SEX--F", ["Bangladesh", "Viet Nam"])
un.save(table, "maternal-mortality.xlsx")

Don't know the indicator's id? un.search("maternal mortality") lists matching indicators with their names; copy the id from the first column. In Colab, install with !pip install undata.

// 03 — functions

Everything on one screen

Wherever a function asks for countries you can write names the way you would in an email ("Viet Nam", "Vietnam", "VNM"), a list of them, or a region such as "Southern Asia" or "Africa". Every function explains itself: help(un.get).

functionwhat it does
un.search("words")Find indicators by what they measure: one row per indicator, with how many places and years have data.
un.about(indicator)What an indicator is, whose it is, its unit, its years, and its SDG metadata.
un.get(indicator, countries, years)The numbers: one row per country and year. by="sex" for a breakdown, wide=True for one column per indicator.
un.latest(indicator, countries)
un.coverage(table)
Each country's most recent value. within=10 keeps only the past ten years and names who is older; coverage says who has what.
un.totals(indicator, ["World", "LDCs"])The official figure for a region or group, as the agency published it.
un.change(indicator, countries, 2015, 2023)Before, after, the difference and the percentage change.
un.compare({"a": id1, "b": id2}, countries)Indicators side by side, with who has which spelled out.
un.countries(region)
un.regions()
The UN M49 list: official names, M49 regions, and the current LDC, LLDC and SIDS groups.
un.sdg.goals()
un.sdg.targets(16)
un.sdg.indicators("16.1")
un.sdg.series("16.1.2")
Walk from an SDG goal down to indicators you can fetch. SDG numbers like "3.1.1" also work directly.
un.progress(indicator, countries, better="lower", target=70)On track for 2030? The UN Statistics Division's progress method, country by country, with the five SDG Report categories.
un.profile(country, indicators)
un.gap(indicator, countries, by="sex")
One country beside its region and the world; the gap between two groups in the same year.
un.trend(...)
un.benchmark(indicator)
un.availability(...)
Change since 2015; UN groups side by side; which countries report what, and how recently.
un.describe(table)
un.chart(table)
Sentences for a report, worked out from the numbers. A publication-ready chart picked to fit the table (bars, lines, small multiples, a tile map, a progress chart and more) with its source. interactive=True for hover and zoom.
un.style()
un.palette()
Give your own matplotlib and seaborn charts the same clean, colour-blind-safe look.
un.save(table, "file.xlsx")
un.cite(table)
Excel or CSV with sources; citations for a report.
un.ai_pack(table, "pack.zip")
un.for_ai(table, task="brief")
un.powerquery(...)
Data, metadata and a prompt to upload to an AI assistant, or to paste; Power Query code for Power BI or Excel.
un.ask("a question")What data.un.org's search box decided, including whether it guessed the place.
undata ...All of it from a terminal: undata totals 3.1.1 World LDCs --latest.

// 04 — what it does for you

The careful parts are built in

Each of these was found by calling the live platform, and each is checked by a test that runs every night.

  • It never guesses a place.data.un.org's search box answers a question about "Bengal" with figures for the United States. undata stops and says it does not know "Bengal".
  • Gaps are named, never zero.Countries without data are listed in a warning and on their own Excel sheet, never charted as zeros.
  • UN names in, UN names out.Tables say Türkiye, Viet Nam and Côte d'Ivoire, ready for a UN document, whatever spelling you typed.
  • The source is on every row.The same statistic can come from several agencies with different numbers. The source column says whose you have.
  • Mixed years are flagged."Latest" means each country's own latest year. When those differ, a warning says so.
  • It works where other clients fail.The platform's firewall blocks Google's own client, and any request that mentions Western Sahara. undata routes around both.

// 05 — in Claude

Ask Claude, and it uses undata

undata is also an MCP connector. Add it to Claude Desktop or Claude Code and ask in plain words: "Which least developed countries are on track to bring maternal mortality below 70 by 2030? Show me a chart." Claude finds the indicator, runs the UN Statistics Division's progress method and answers with the table, the chart, the caveats and the sources, all from the same tested functions on this page.

Claude Desktop

Install uv, then in Settings → Developer → Edit Config add:

{
  "mcpServers": {
    "undata": {
      "command": "uvx",
      "args": ["--from", "undata[mcp]",
               "undata-mcp"]
    }
  }
}

Claude Code

One command:

claude mcp add undata -- \
  uvx --from "undata[mcp]" undata-mcp

Other MCP clients: pip install "undata[mcp]", then run undata-mcp (stdio) or undata-mcp --http.

What Claude can do

Fourteen read-only tools: find indicators by words or SDG number, list countries and groups, fetch data, and run progress, profile, gap and benchmark analyses, with charts. No account, no key.

// 06 — install

Getting it

On your computer

Needs Python 3.11 or newer. Comes with pandas and Excel support.

pip install undata

In Google Colab

Nothing to install on your machine. Run this in the first cell.

!pip install undata

Run these use cases

With uv, which fetches the right Python itself.

git clone https://github.com/nerd-factory/undata
cd undata
uv run python examples/01_country_briefing.py